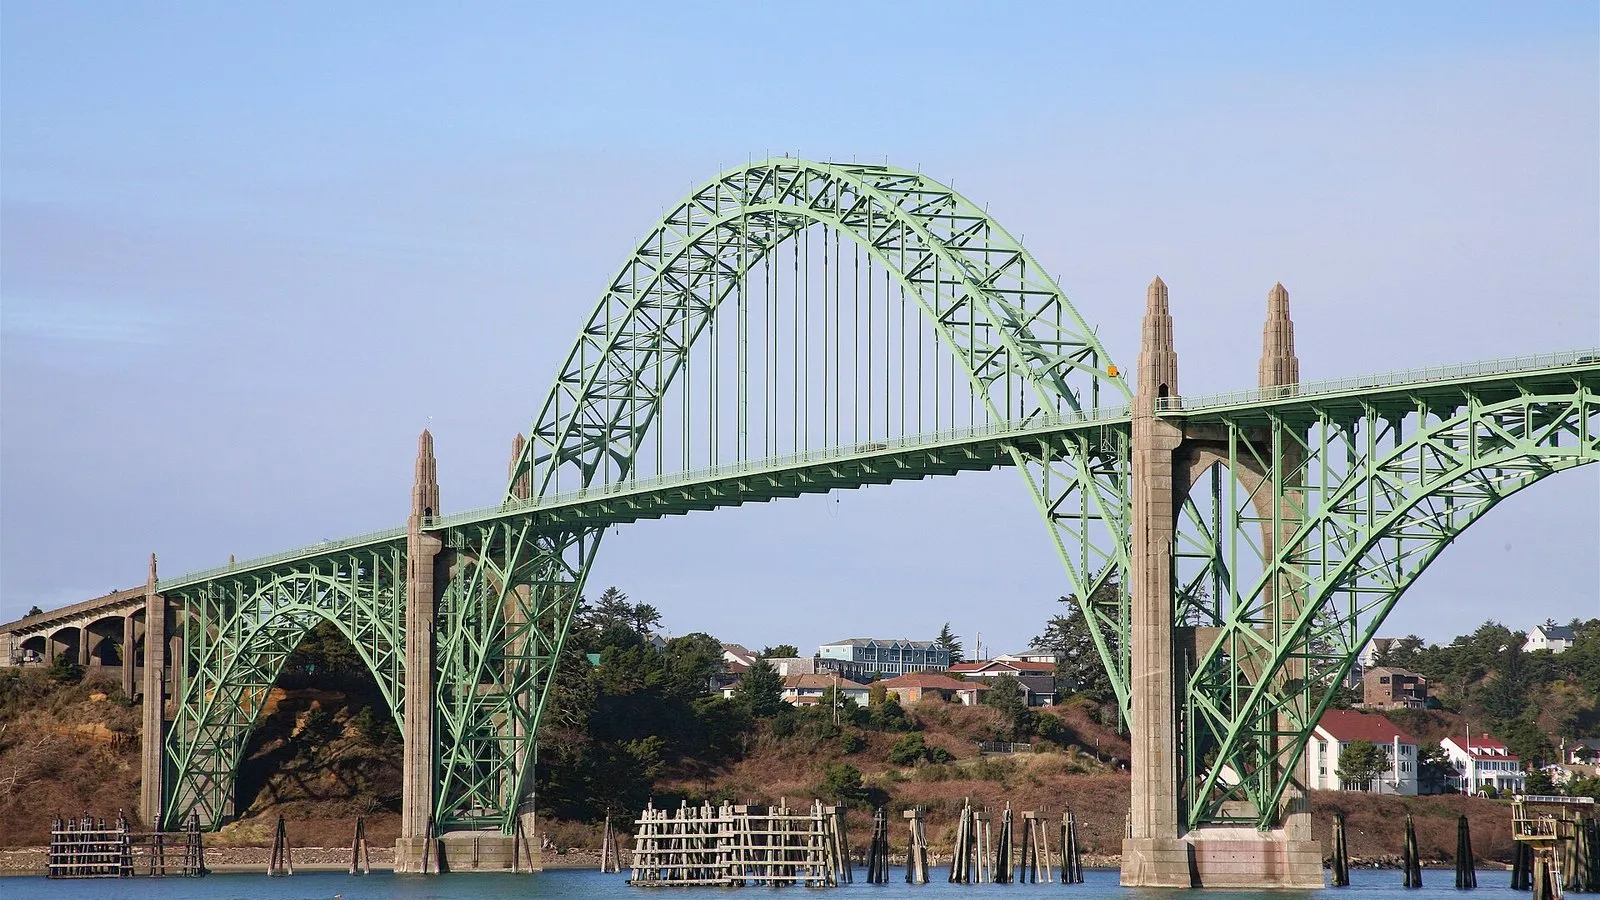
Yaquina Bay Bridge in Newport. Photo: User:Cacophony, CC BY 2.5, via Wikimedia Commons.
Every two weeks, researchers still run the Newport Hydrographic Line — a set of ocean stations off Newport that has become one of the California Current’s longest continuous records of temperature, chemistry and plankton — while summer hypoxia keeps returning to the same stretch of coast that feeds the local fleet.
NOAA Fisheries and Oregon State University use the line to track upwelling, oxygen, acidification and harmful algae. The data feed forecasts that crabbers, salmon trollers and state managers already treat as operational weather: when oxygen crashes near the bottom, Dungeness and other species move or die. When domoic acid spikes, razor clam and crab seasons close.
A NOAA science blog this year again tied low-oxygen water to foggy, upwelling-heavy stretches off the Oregon coast, the same pattern fishers describe as “dead water” when pots come up empty or soft.
Why Newport sits at the center
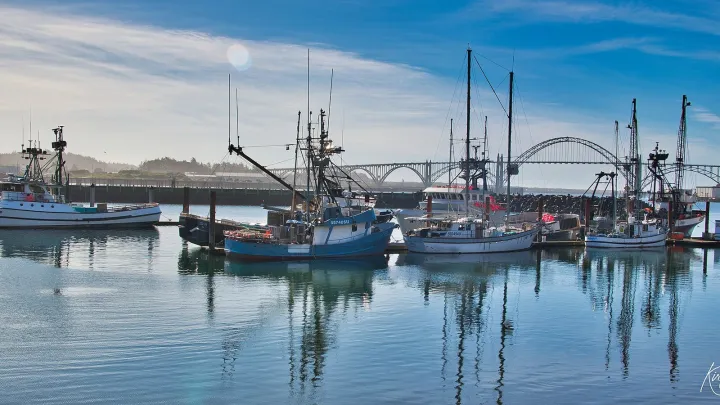
The city’s harbor, Hatfield Marine Science Center and NOAA labs make Newport the practical capital of Oregon coast oceanography. Instruments go back in the water from here. Grad students and federal scientists share dock space with the fleet that depends on their models.
That overlap is not sentimental. Hypoxia and acidification are no longer abstract climate slides at a conference. They are reasons a processor shortens a shift or a captain steams farther for legal crab. The Newport line’s value is the length of the record — decades of comparable samples — which lets researchers say whether this year’s low oxygen is a blip or a trend.
Whales on the same highway
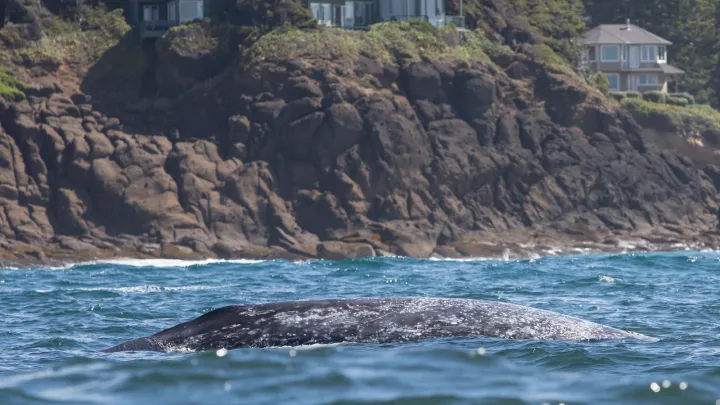
Gray whales moving along the Oregon coast have their own warning lights. Scientists meeting in Newport earlier this year said the eastern Pacific population is not headed for extinction, but declining counts and skinny animals point to food-web trouble tied to Arctic ice and prey. NOAA has logged elevated whale mortality along the West Coast in recent seasons.
For a harbor town, whales are tourism and risk at once: whale-watching dollars in good years, entanglement and ship-strike worries in bad ones. The same research community that samples the hydrographic line also briefs managers on whale distancing rules that can slow fishing.
None of that pauses the next cruise. The line will be run again on schedule, oxygen sensors will spit out another map, and Newport’s fleet will decide where to set gear with whatever the water column is doing — clearer for having been measured, even when the news is not good.
Processors and cold-storage operators watch the same oxygen and toxin dashboards. A hypoxia event that pushes crab out of familiar grounds changes trucking costs and plant throughput within days. Science that stays offshore in a PDF does not help them; science that reaches a morning radio forecast does.
State managers lean on the Newport record when they defend season delays to angry meetings. Fishers lean on it when they argue for reopenings. The line’s credibility depends on continuity. Budget cuts that skip cruises would punch holes in a dataset the coast has paid for, in ship time and patience, for decades.
Tourism marketers sell whale spouts and bridge views. The hydrographic line sells something less photogenic and more valuable: evidence. Newport’s bet is that a working waterfront can hold both — the visitors who come for the bay, and the scientists whose cruises explain why the bay’s fisheries still exist.
Readers who want the raw numbers can follow NOAA’s West Coast science updates and the Newport line summaries as they post. The story on the water is updated every two weeks whether or not a newspaper is watching.
When the next hypoxia map lands, Newport’s docks will translate it into set locations and soak times faster than any headline can. The job of local coverage is to keep that translation public — so residents who never pull a pot still understand why a season shortens, and so the labs that run the Newport line keep the political support that ship time requires.